Financial & Predictive Modelling
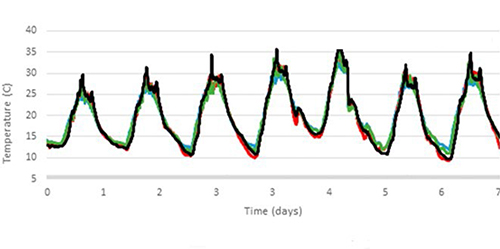
Time series analysis of economic -, financial and stock data. Analysis done with Python, R or Octave/Matlab.
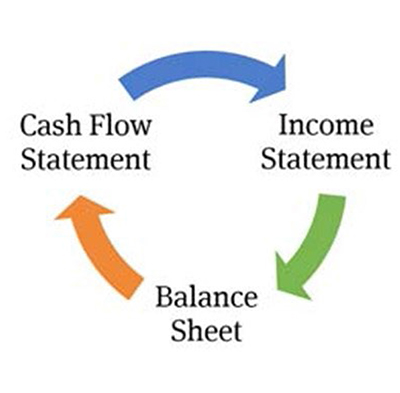
The three statement analysis integrates the Income Statement, Balance sheet and Cash Flow by considering different scenarios in a way that is visual through effective bespoke dashboards.
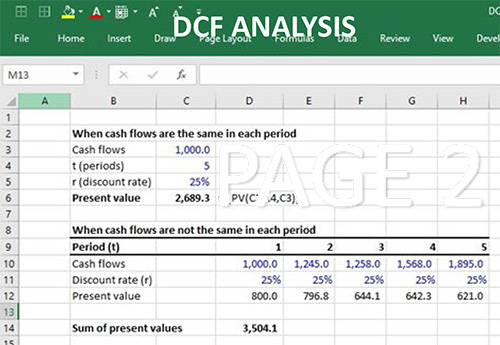
The Discounted Cash Flow is calculated using the NPVX function in EXCEL. This allows for unequal time periods to be integrated into the valuation.
Comparative company analysis is achieved by downloading the financial data from individual companies in the same industry from the internet from sites such as Vanguard. This allows for up to date analysis and time series analysis.
Portfolio Optimization
Predictive modelling allows you to get a deep understanding of the interaction between different sources of data to be examined. Models in Python, R and Octave/Matlab are constructed. Examples include Decision trees, Regression analysis, Nearest neighbour and Neural network models.