Financial & Predictive Modelling
Our Time Series Intelligence platform transforms raw economic, financial, and stock market data into actionable insight using advanced analytics in Python, R, or Octave/MATLAB. Simply download historical price data from Yahoo Finance (search your ticker, select “Historical Data,” and download the CSV file), upload it directly into the system, and the platform will automatically clean, structure, and prepare the dataset for professional analysis. From trend decomposition and volatility analysis to ARIMA, GARCH, regime-switching, machine learning, and Monte Carlo forecasting, the system extracts meaningful patterns from complex market behavior and delivers forward-looking projections, risk metrics, and investor-ready outputs—turning historical data into strategic intelligence.
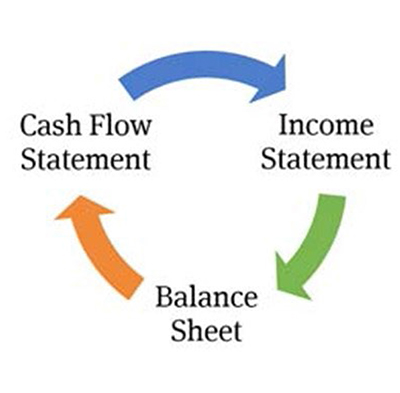
The three statement analysis integrates the Income Statement, Balance sheet and Cash Flow by considering different scenarios in a way that is visual through effective bespoke dashboards.
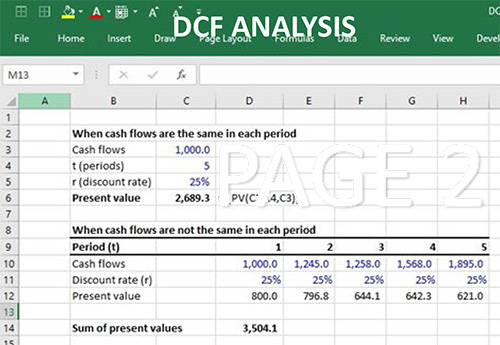
The Discounted Cash Flow is calculated using the NPVX function in EXCEL. This allows for unequal time periods to be integrated into the valuation.
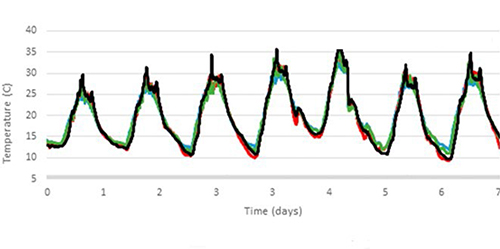
Comparative company analysis is achieved by downloading the financial data from individual companies in the same industry from the internet from sites such as Vanguard. This allows for up to date analysis and time series analysis.
Portfolio Optimization
Predictive modelling allows you to get a deep understanding of the interaction between different sources of data to be examined. Models in Python, R and Octave/Matlab are constructed. Examples include Decision trees, Regression analysis, Nearest neighbour and Neural network models.